MCU Ramdump Feature
Currently, crash information for MCU0 and MCU1 shares the same memory region. If MCU0 and MCU1 crash simultaneously, the information saved by the MCU ramdump feature becomes unreliable.
Overview
The MCU ramdump feature was developed primarily to print and preserve exception information when the MCU crashes or enters an abnormal state, facilitating analysis and localization of the root cause.
Exception Handling Flow
When the MCU enters an exception, it saves the context information into a global variable. This global variable can be read either by the A-core or via the MCU shell.
If MCU0 encounters an exception, the system will reboot. During the reboot process, the system checks the reboot reason. If the reboot reason is identified as mpainc, the system ensures that the memory region corresponding to the global variable storing the MCU exception context is not cleared to zero. Consequently, after system reboot, we can retrieve the ramdump data and analyze the cause of the exception.
The exception handling flow is illustrated below:
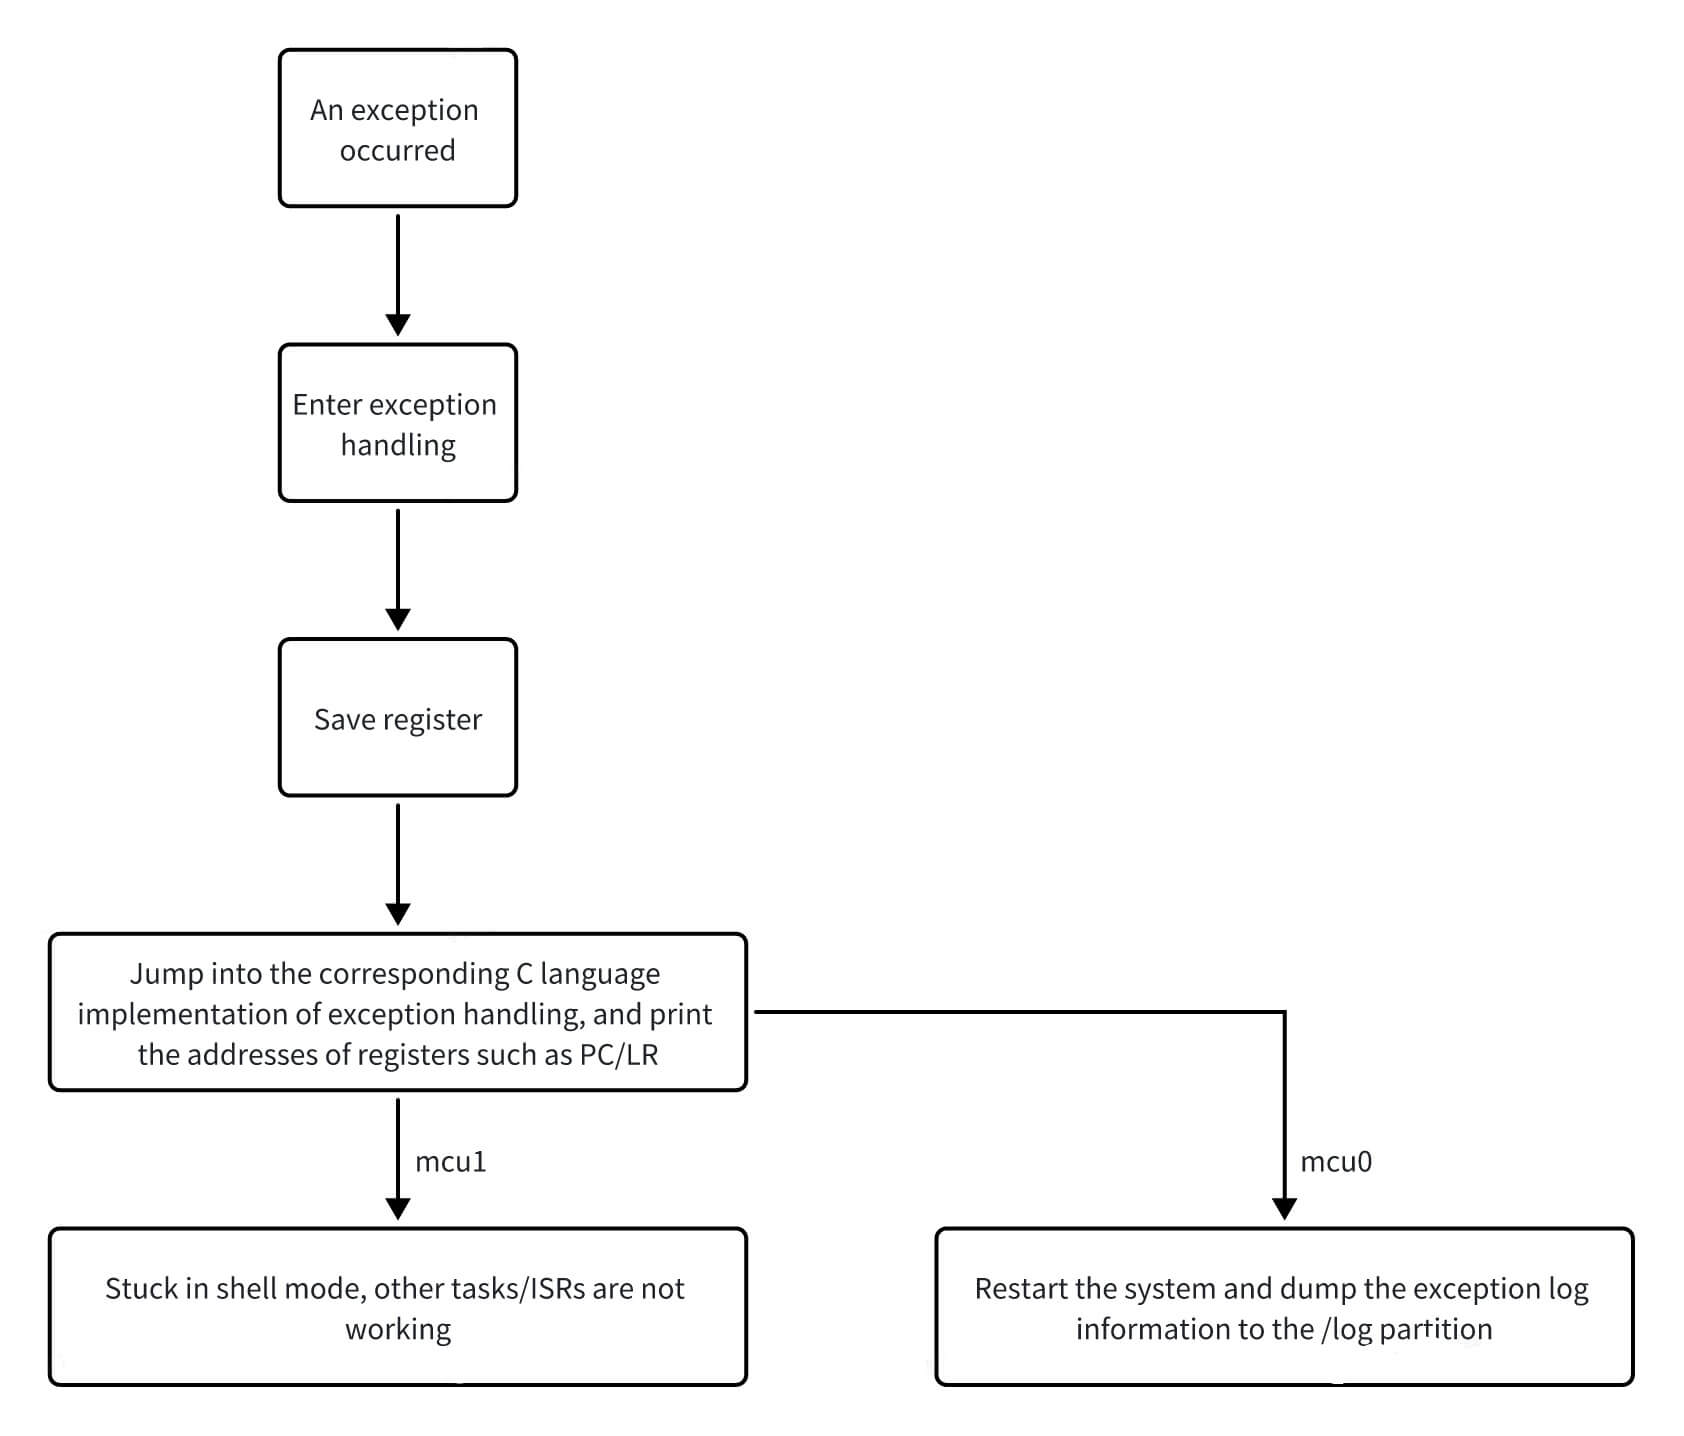
The exception handling flows for MCU0 and MCU1 are largely similar, with the only difference being that MCU0 triggers a system reboot after handling the exception.
Rebooting MCU1 After an Exception
When MCU1 encounters an exception, it drops into the shell. At this point, you can stop and restart MCU1 using the A-core remoteproc control mechanism. Example commands are as follows:
  # Stop execution
  echo stop > /sys/class/remoteproc/remoteproc_MCU0/state
  # Start execution
  echo start > /sys/class/remoteproc/remoteproc_MCU0/state
Retrieving MCU Exception Information
-
You can read the context information recorded during an MCU1 exception via a sysfs node on the A-core. The corresponding sysfs path is:
cat /sys/devices/platform/soc/soc:mcu_crash/crash -
When MCU0 crashes and the system reboots, if the reboot reason is determined to be
mpainc, the context information is dumped to the/logpartition for historical log analysis. The dumped log directory follows the naming format:SuperSoC_Mdump-<count>-<time>.
Here,<count>indicates the number of system reboots, and<time>represents the timestamp in the format:Year_Month_Day_Hour_Minute_Second, for example:SuperSoC_Mdump-0010-2025_08_13_20_25_11. -
When the MCU encounters data abort, undefined instruction, or prefetch abort exceptions, it can dump the context information to aid in debugging.
Analyzing Exception Logs
Taking a data abort exception as an example, the recorded exception information is explained below:
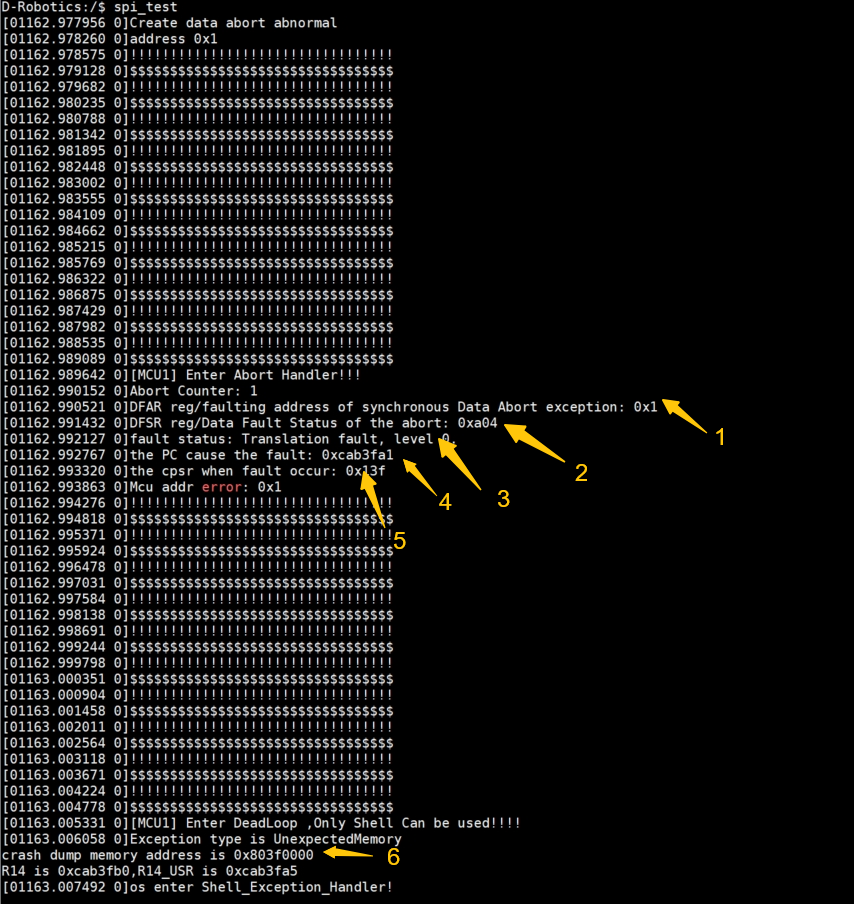
The meaning of each data field is as follows:
-
Arrow 1 indicates the memory address being accessed when the data abort occurred. As shown in the figure, the exception happened while attempting to access address
0x1. -
Arrow 2 shows the exception status data, which is generally not critical for analysis.
-
Arrow 3 indicates the type of exception that occurred.
-
Arrow 4 shows the address of the instruction that triggered the exception. By combining this address with ELF symbol information, we can pinpoint the exact source code location where the exception occurred. Example:
addr2line -e S100_MCU_DEBUG.elf 0xcab3fa1If
addr2lineis not installed on your system, you can install it using the following commands:sudo apt update
sudo apt install binutils -y -
Arrow 5 shows the value of the CPU's CPSR (Current Program Status Register) at the time of the exception.
-
Arrow 6 indicates the memory address where the crash dump was saved. You can read the saved register and stack context either by entering
dumpmem [addr] 4 64in the MCU shell, or by accessing the crash context via sysfs on the A-core.