5.5.4 Performance Flame Graph
Introduction
A flame graph is a graphical way to display performance data collected by tools such as perf. It aggregates and analyzes the data to help identify performance hotspots.
Each box in a flame graph represents a function. The width of a box represents its execution time, so wider functions take longer to execute.
Each level higher in the flame graph represents a deeper function call. The top-level functions are leaf functions.
Code repository: (https://github.com/brendangregg/FlameGraph.git)
Supported Platforms
| Platform | Runtime Environment |
|---|---|
| RDK X3, RDK X3 Module, RDK X5, RDK X5 Module | Ubuntu 20.04 (Foxy), Ubuntu 22.04 (Humble) |
Preparation
RDK Platform
-
The flame graph tool consists of two parts. The first part is the
perfexecutable.perfis a software performance analysis tool used to collect and output function call statistics for the system or a specific process. The RDK operating system already includesperf, so you can use it directly. -
The second part of the flame graph tool is a script that parses perf text output. The script parses the text data collected by perf and generates an SVG function call flame graph for easy observation and analysis.
Usage
-
Use the
perf recordtool to sample function calls on the RDK system and generate aperf.datafile.root@ubuntu:~# perf record -F 99 -a -g -- sleep 60 -
Use
perf scriptto parse theperf.datafile and generateout.perf.root@ubuntu:~# perf script > out.perf -
On a PC or RDK, run
git clone https://github.com/brendangregg/FlameGraph.git, enter the flamegraph directory, and copy theout.perffile generated in step 2 into the flamegraph directory. Usestackcollapse-perf.plfrom the flame graph tool package to collapseout.perfintoout.folded../stackcollapse-perf.pl out.perf > out.folded -
Use
flamegraph.plto generate an SVG flame graph../flamegraph.pl out.folded > flame.svg
Steps 1 and 2 are performed on the RDK. Steps 3 and 4 can be performed on a PC or RDK.
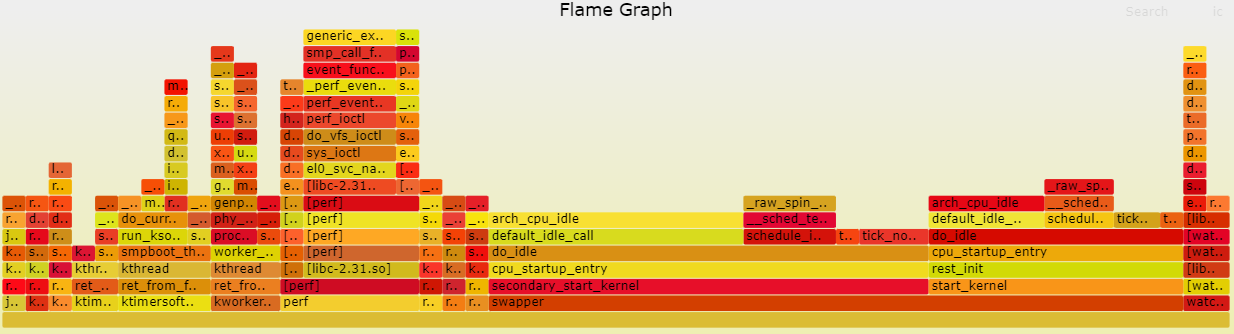
Result Analysis
After following the workflow in the previous section, the function calls recorded on the RDK system are shown below.