7.2.6 Applying Real-Time Kernel
This chapter aims to describe how to enable real-time kernel (Preempt-RT kernel) on RDK X3 and RDK X3 Module, and provide the corresponding commands for users to use. Real-time kernel is an operating system kernel that can provide more precise and reliable response time, and is commonly used in applications with high time sensitivity requirements, such as robot control and industrial automation. The following are the related commands for enabling and disabling real-time kernel, as well as some common use cases and testing methods.
Command to Enable Real-Time Kernel
To enable real-time kernel on RDK, you need to modify the /boot/boot.cmd file:
- Change
imagefile="Image"toimagefile="Image-rt". - Navigate to the
/boot/directory and executemkimage -C none -A arm -T script -d boot.cmd boot.scr. - Reboot the system to switch to the real-time kernel.
You can use the uname -a command to see the kernel version information with PREEMPT RT indication.

Command to Restore to Standard Kernel
To switch back to the standard kernel, change imagefile="Image-rt" back to imagefile="Image"
Real-Time Performance Testing
When you need to test the performance of the real-time kernel, a commonly used performance testing tool is rt-tests, which includes multiple test programs that can be used to test the performance of the real-time kernel. Here is an example of performing performance testing with rt-tests:
Installing the rt-tests Tool
If the rt-tests tool has not been installed yet, you can use the following command to install it:
sudo apt install rt-tests
Running the cyclictest Test
The cyclictest test is a commonly used test in rt-tests, which is used to evaluate the timing behavior and response time of the system. Execute the following command to run the cyclictest test:
sudo cyclictest -l50000000 -m -S -p90 -i200 -h400
This command will run a real-time performance test with the following options:
-l50000000: Sets the number of iterations for the test to run.-m: Specifies thatcyclictestwill lock the current and upcoming memory through mlock during the test to prevent swap interference.-S: Specifies the standard SMP architecture test, where all threads will use the same -a -t -n and priorities.-p90: Specifies the priority of the real-time thread.-p90means the test will run in the real-time scheduling class with a priority of 90.-i200: Sets the sleep time for the test threads.-h400: After the test is completed, output a histogram and the count of times the latency was less than the specified value (400) in microseconds.
The test results will display the minimum, maximum, and average latency of the system, as well as some other performance statistics.
Analyzing Test Results
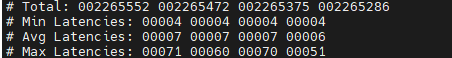
Analyze the cyclictest test results to assess the performance of the real-time kernel. Pay attention to the minimum and maximum latencies to ensure they are within an acceptable range. Smaller maximum latency and more consistent latency indicate better performance of the real-time kernel. The following graphs show the results of the test when using a real-time kernel and running the /app/pydev_demo/03_mipi_camera_sample example.
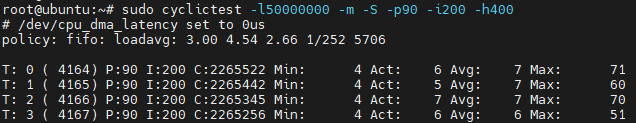
The meaning of each field in the cyclictest output is as follows:
T: Thread identifier and thread number for the test run.P: Priority used during the test run. In your output, it has a value of 90, indicating the test ran in the real-time scheduling class with a priority of 90.I: Expected wake-up period for the latency measurement thread in microseconds.C: Number of measurements taken for the latency, i.e., the loop count.Min: Minimum latency for the current test cycle in microseconds.Act: Actual latency for the current test cycle in microseconds.Avg: Average latency for the current test cycle in microseconds.Max: Maximum latency for the current test cycle in microseconds.
The default Linux kernel does not support real-time capabilities. To achieve low latency and deterministic responses, the PREEMPT-RT patch (e.g., patch-6.1.83-rt28) must be introduced to enable real-time kernel functionality.
An official precompiled real-time kernel version is provided to simplify the build process, but the following should be noted:
- This version is a community-maintained derivative branch, not the official mainline kernel;
- It has not undergone large-scale industrial application validation, so developers must assess its stability and compatibility independently;
- There are potential risks associated with using this version, and it is recommended to deploy it only in scenarios where thorough testing and validation have been conducted, and the associated risks are deemed acceptable.