Ethernet Performance Testing
This chapter aims to guide you on how to perform Ethernet performance testing using the iperf3 tool. You can refer to iperf3 for detailed usage instructions of this command.
Key Focus Areas for Ethernet Performance Testing:
- Bandwidth and Throughput: Test the actual available bandwidth of the Ethernet connection to evaluate its performance under high load.
- Latency: Assess the transmission delay over the Ethernet network. Increased latency under high load may negatively impact real-time applications.
- Packet Loss Rate: Measure the rate at which data packets are lost during transmission to evaluate network stability. Excessive packet loss compromises data integrity.
Testing Principle
Ethernet performance testing relies on data transmission between a client and a server. The underlying principle is as follows:
- Server Side:
iperf3listens on a specified port, waiting for client connections. The server calculates actual bandwidth and throughput by recording the amount of received data and the time interval. - Client Side: The client actively connects to the server and sends data packets at a specified rate and interval to simulate network traffic load.
- Statistics Collection: During the test,
iperf3records key metrics—including bandwidth, latency, packet loss rate, and retransmission count—to facilitate network performance analysis.
Preparation
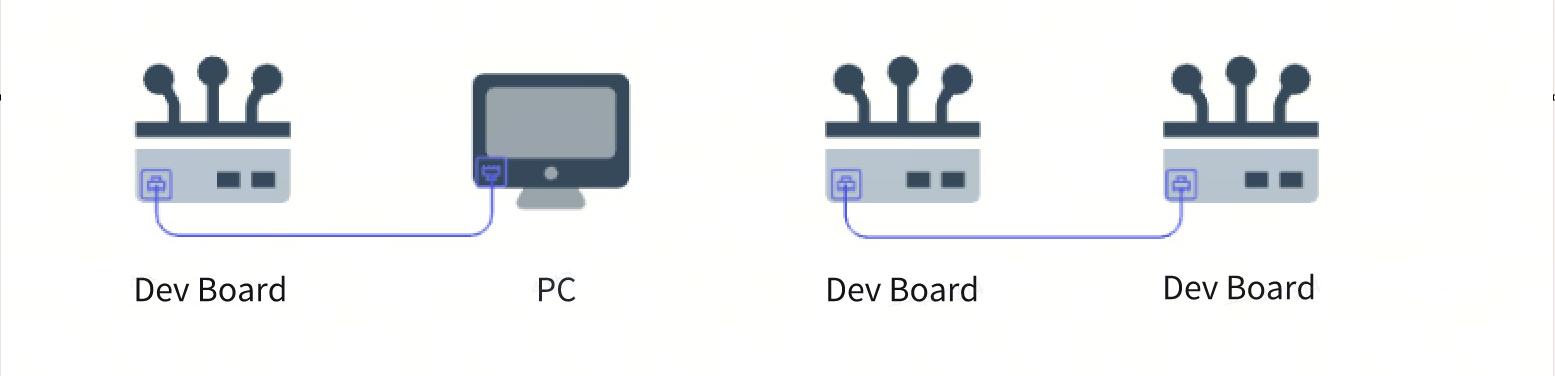
- Select Connection Method: Direct connection between
development boardandPC, or direct connection between twodevelopment boards. - Identify Server and Client: The development board can act as either client or server; the peer device can be a personal computer (PC) or another development board.
- Ensure Same Subnet: Configure both devices with IP addresses in the same subnet.
Note: The test configurations described in this chapter are for reference only. Users should adjust test settings according to their actual hardware setup.
Example Configuration
In this test, the following configuration is used:
- Connection Method: Direct connection between
development boardandPC. - Server (PC): IP address
192.168.127.195 - Client (Development Board): IP address
192.168.127.10
Execute the following command to test Ethernet connectivity between the PC and the development board:
ping -I eth0 192.168.127.195
Execution result:
PING 192.168.127.195 (192.168.127.195) from 192.168.127.10 eth0: 56(84) bytes of data.
64 bytes from 192.168.127.195: icmp_seq=1 ttl=128 time=1.54 ms
64 bytes from 192.168.127.195: icmp_seq=2 ttl=128 time=1.28 ms
64 bytes from 192.168.127.195: icmp_seq=3 ttl=128 time=1.57 ms
64 bytes from 192.168.127.195: icmp_seq=4 ttl=128 time=1.40 ms
Testing Procedure
Step 1: Start the Server
On the PC, use iperf3 to start the server. First, download and install the iperf3 package from the iperf official website.
On Windows, run the following command in the Command Prompt (cmd):
iperf3 -s -p 5002
Startup log:
-----------------------------------------------------------
Server listening on 5002
-----------------------------------------------------------
Log after successful client connection:
Accepted connection from 192.168.127.10, port 51592
[  5] local 192.168.127.195 port 5002 connected to 192.168.127.10 port 51598
[ ID] Interval           Transfer     Bitrate
[  5]   0.00-1.00   sec   112 MBytes   937 Mbits/sec
[  5]   1.00-2.01   sec   113 MBytes   940 Mbits/sec
[  5]   2.01-3.01   sec   112 MBytes   941 Mbits/sec
[  5]   3.01-4.01   sec   113 MBytes   942 Mbits/sec
[  5]   4.01-5.01   sec   112 MBytes   941 Mbits/sec
[  5]   5.01-6.01   sec   113 MBytes   942 Mbits/sec
[  5]   6.01-7.01   sec   112 MBytes   942 Mbits/sec
[  5]   7.01-8.01   sec   112 MBytes   941 Mbits/sec
[  5]   8.01-9.00   sec   111 MBytes   941 Mbits/sec
[  5]   8.01-9.00   sec   111 MBytes   941 Mbits/sec
Step 2: Start the Client
On the development board, launch the iperf3 client, specifying the server's IP address and port number, then begin the test.
Execute the command:
iperf3 -c 192.168.127.195 -i 1 -t 600 -p 5002
Command parameter explanation:
-c: Specifies the server's IP address.-i: Interval (in seconds) between periodic bandwidth reports.-t: Total test duration (in seconds).-p: Specifies the port number the server is listening on.
Execution log:
Connecting to host 192.168.127.195, port 5002
[  5] local 192.168.127.10 port 51598 connected to 192.168.127.195 port 5002
[ ID] Interval           Transfer     Bitrate         Retr  Cwnd
[  5]   0.00-1.00   sec   115 MBytes   965 Mbits/sec    0    381 KBytes
[  5]   1.00-2.00   sec   113 MBytes   947 Mbits/sec    0    402 KBytes
[  5]   2.00-3.00   sec   113 MBytes   949 Mbits/sec    0    402 KBytes
[  5]   3.00-4.00   sec   113 MBytes   950 Mbits/sec    0    402 KBytes
[  5]   4.00-5.00   sec   113 MBytes   949 Mbits/sec    0    402 KBytes
[  5]   5.00-6.00   sec   114 MBytes   956 Mbits/sec    0    425 KBytes
[  5]   6.00-7.00   sec   113 MBytes   947 Mbits/sec    0    492 KBytes
[  5]   7.00-8.00   sec   114 MBytes   954 Mbits/sec    0    492 KBytes
Test Criteria
Test Results
Refer to iperf3 – Test Result Analysis for explanations of each field in the output.
To achieve optimal performance test results, ensure the following conditions:
- The client and server are directly connected via a high-quality Ethernet cable.
- Both client and server have successfully negotiated a 1000 Mbps (Gigabit) link speed.
- No other high-load tasks are running on either the client or server during the test.
Current performance metrics obtained from our testing (for reference only):
Receive bandwidth: 949 Mbits/sec
Transmit bandwidth: 950 Mbits/sec
Common Issues
1. Why can't the iperf3 client connect to the server?
-
Root Causes:
- The client and server are not on the same subnet, or IP addresses are misconfigured.
- A firewall is blocking the port used by
iperf3. - The server is not running correctly or is not listening on the specified port.
-
Solutions:
- Ensure the client and server IP addresses are in the same subnet and can communicate via
ping. - Check firewall settings and allow traffic through the
iperf3port (e.g.,5002). - Confirm that the server has correctly executed the
iperf3 -scommand and is actively listening.
- Ensure the client and server IP addresses are in the same subnet and can communicate via
2. Why is the measured bandwidth lower than expected?
-
Root Causes:
- Network hardware (e.g., NIC) does not support Gigabit speeds, or the link failed to negotiate to 1000 Mbps.
- The client or server is running other high-load tasks that impact performance.
-
Solutions:
- Verify that the hardware supports Gigabit Ethernet; if necessary, force the NIC to negotiate at 1000 Mbps.
- Before testing, close any applications or processes on the client and server that may consume network or system resources.
3. Why is there a high packet loss rate during testing?
-
Root Causes:
- Network interference or poor-quality Ethernet cables.
- Network configuration (e.g., buffer size) on the test devices is inadequate.
-
Solutions:
- Use high-quality Ethernet cables and ensure stable, interference-free connections.
- Adjust network settings, such as increasing TCP buffer sizes:
sysctl net.core.rmem_max # View maximum receive buffer size (rmem_max)
sysctl net.core.wmem_max # View maximum send buffer size (wmem_max)
sysctl -w net.core.rmem_max=2500000 # Set max receive buffer to 2,500,000 bytes
sysctl -w net.core.wmem_max=2500000 # Set max send buffer to 2,500,000 bytes
4. How to resolve the “Address already in use” error when running iperf3?
-
Root Cause: This error typically occurs because the server port is already occupied, often by another
iperf3instance that hasn’t been terminated. -
Solutions:
- Ensure no other
iperf3server instance is running, or start the server on a different port:iperf3 -s -p <new_port_number> - Identify and terminate the process occupying the port:
netstat -tuln | grep 5002
kill <process_ID>
- Ensure no other
Tip: If the above methods do not resolve the issue, please refer to the iperf3 official documentation or relevant technical forums for further assistance.